Text analytics is the gateway for getting in touch with your customers’ thoughts and feelings in a more intimate manner. With this type of qualitative analysis, you’re not only assessing small-scale issues here and there, but also the entire online customer journey as a whole.
How, you ask? Well, text analytics can reveal a plethora of information:
It identifies the root of the problem, or the source of satisfaction. With open-ended questions, customers are given the chance to identify what is or isn’t to their satisfaction, and why.
It also enables the emerging trends to surface which many surveys often limit or restrict entirely.
Issues can be prioritized quickly and efficiently. For example, by identifying the most frequently used words or using word pairing.
Customers’ ideas and suggestions materialize and are elaborated upon, which can lead to an enhanced digital experience.
Implementing text analytics gives you the power to hear your customer’s voice in all its forms.
Finding the Text Analytics in Mopinion :
In the top left of the page, open the Reporting tab, under there you can find the Text analytics.

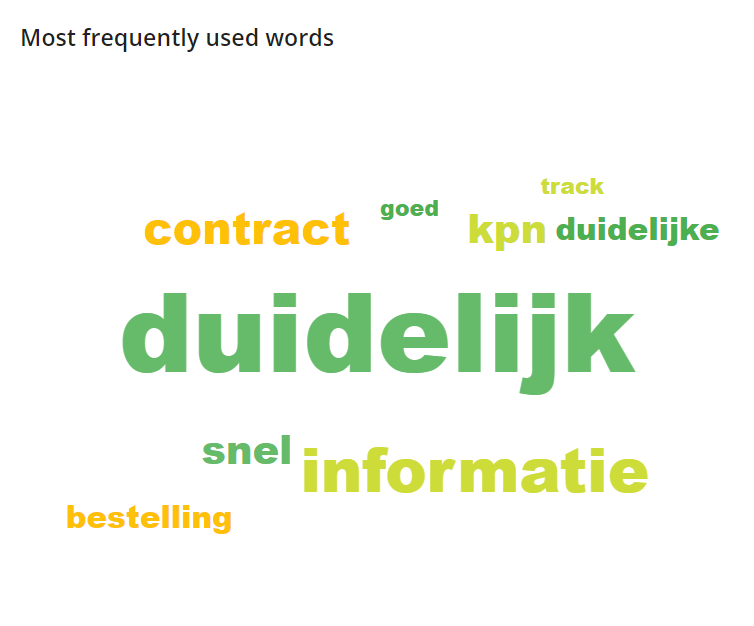
Now you will see a screen with different words. These are the most frequently used by customers by giving their feedback. This is a very handy and quick overview to see how positive and negative customers are. The words are shown in different colours. Green (positive), Orange (neutral), Red (negative).
The text analytics techniques :
Frequency of words (word count)
This is text analytics in its simplest form, whereby the topics are counted and brought to the top based on the frequency with which they are mentioned.
Word grouping (or word pairing)
Often times a group of words can provide you with more insight than just one word alone. For example, the words “costs”, “expensive” and “monthly” are grouped together. With this information, it’s pretty safe to conclude that there are many customers that think the monthly costs for one of your products or services are too expensive. But to take a closer look you can always open the individual comments.
Sentiment analysis
In addition to seeing the most frequently used words (used by customers), you also get an overview of the sentiment behind the feedback. Here you can see all feedback items and how these items are divided into positive, neutral or negative items (sentiment distribution). This enables you to quickly and easily identify the ratio of positive, neutral and negative comments.

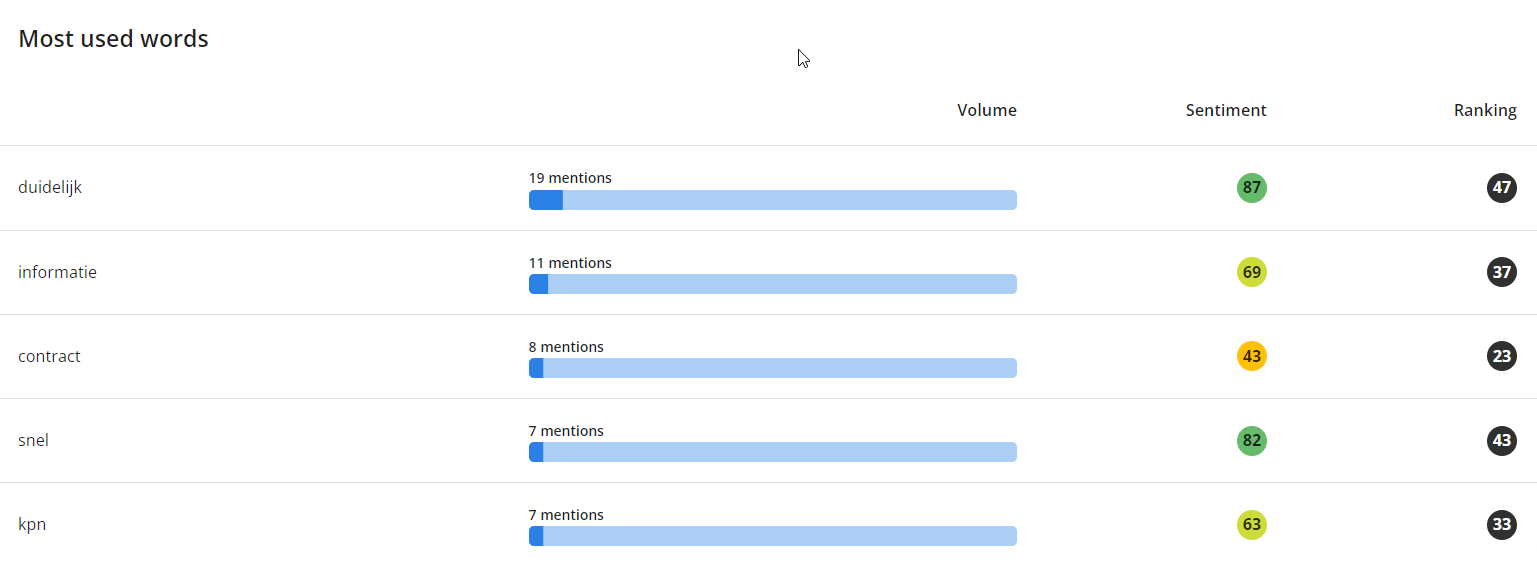
Below the sentiment you can find an overview of the top 5 positive and negative comments, as well as the most used words.
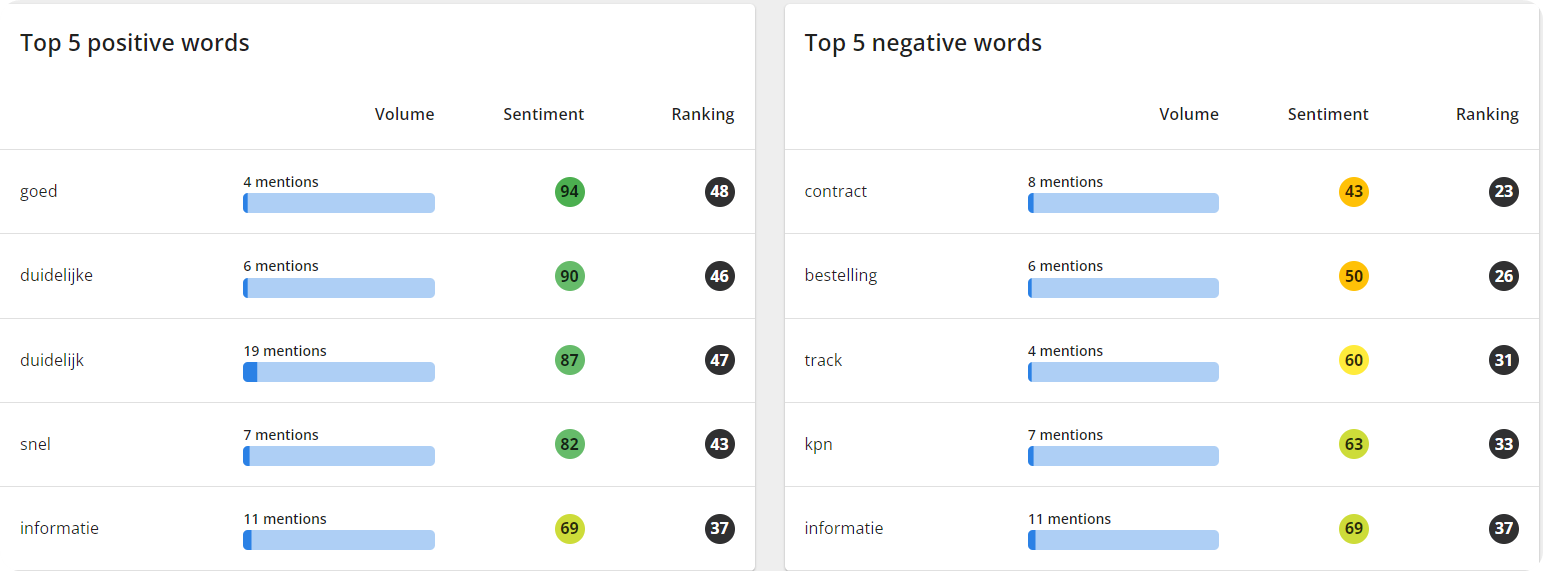
Our sentiment analysis focuses on verbs, (pro)nouns, adverbs, and adjectives. If not relevant, it excludes prepositions and articles. It is currently not possible to define words that need to be excluded.
Filters
Within the text analytics, you can specify the open comments that need to be included in the analysis. You can either filter on all open comment feedback or only feedback from a particular report. You can also filter the TA for a specific form. There is also the option to view the text analytics by words or groups of words, both can have their uses.

If your Text Analysis screen shows the below message, you require some additional open comments before the analysis will be executed.