New to feedback analysis on the Mopinion platform?
No problem, we are here to help you out with building your own charts "the easy way". You can do this by using our predefined chart templates. Just read the instructions below.
Step 1
Go to your dashboard and click on 'Reporting > Dashboard' in the main menu.

Step 2
Click on ‘+ CHARTS', in the bottom right corner, then 'New chart’, to set up your own charts.
Step 3
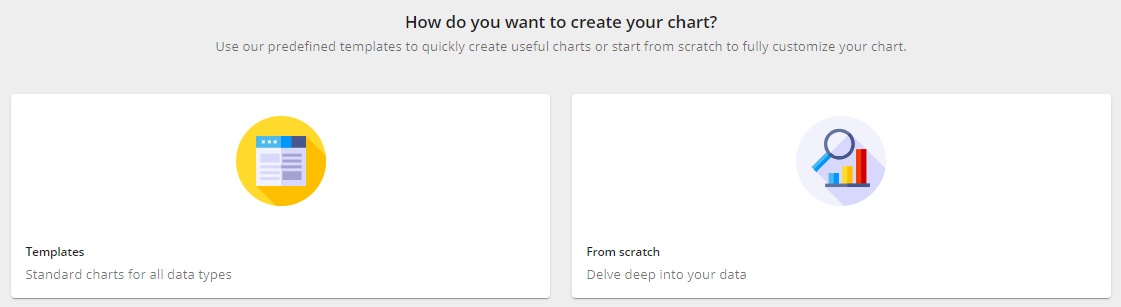
Create a chart quickly by choosing predefined charts / templates. Click ‘Templates’.
Note: The "Start from scratch" option is for more experienced users with experience in data analysis.
Step 4
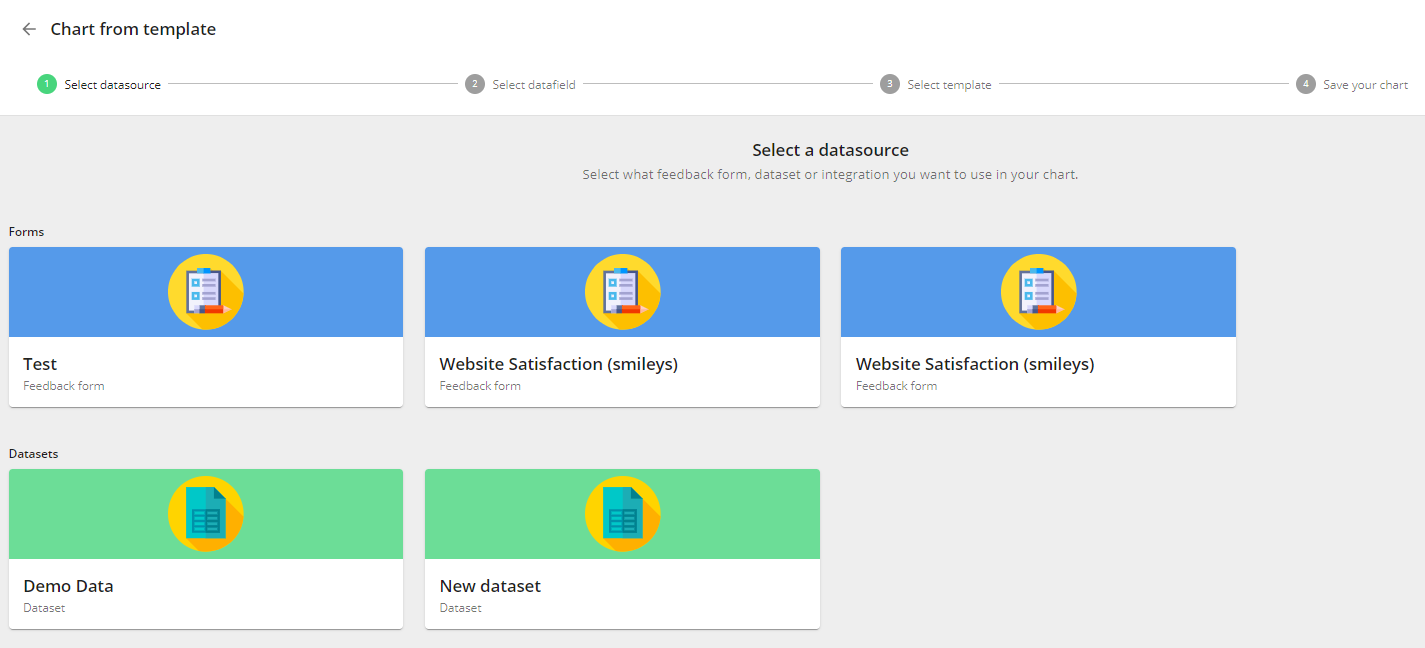
Select your data source and choose your visualization. This can either be a feedback form or data from a CSV or XLS file that you have just imported.
Step 5
Select the data field you want to use in your chart.

Step 6
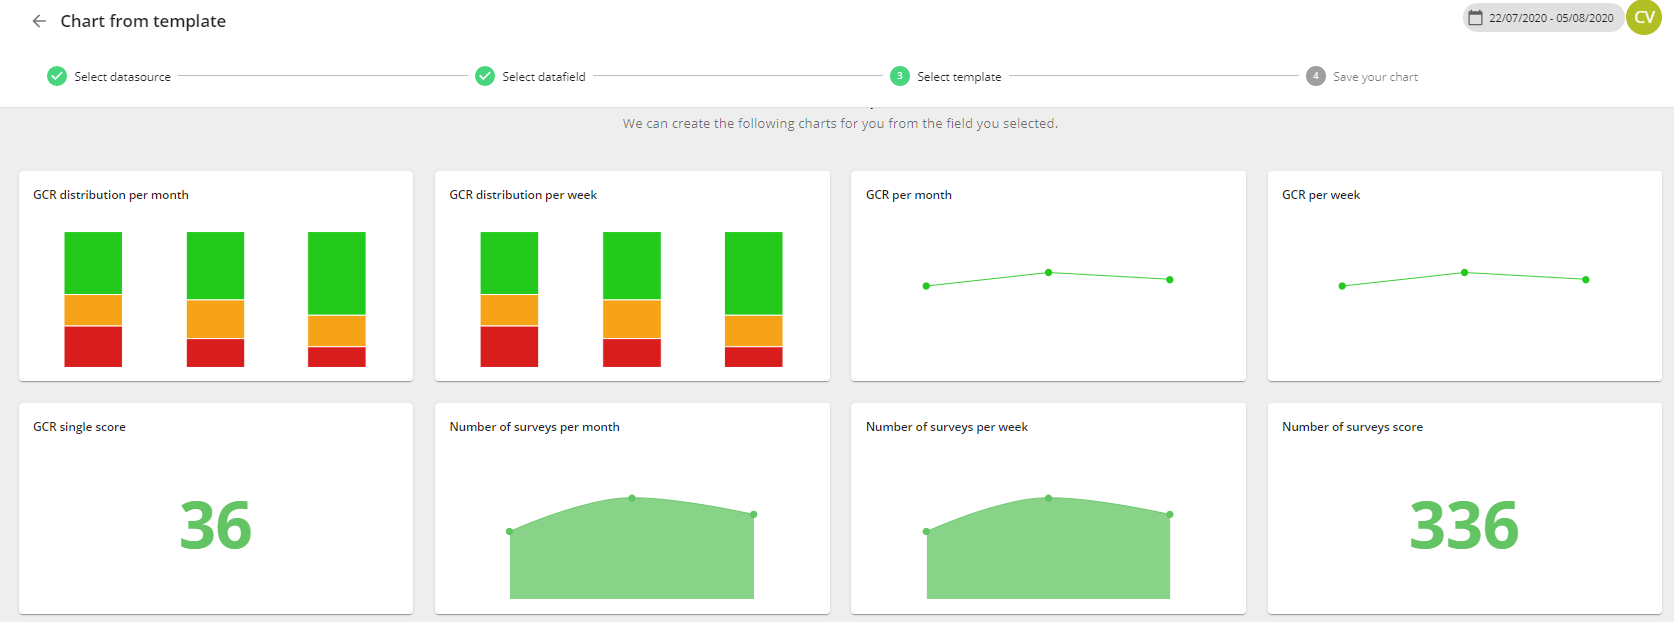
Select a template for your chart.
Step 7
When the chart is created, click on ‘Save to dashboard’.
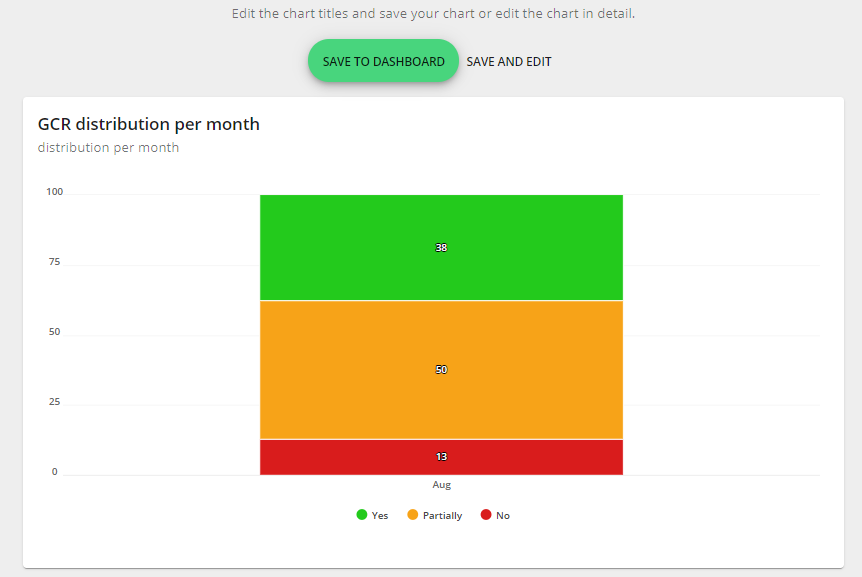
Well done, now your chart is successfully added to your dashboard!