The checkbox element is similar to Radio button, however, with checkbox, the respondent can also select multiple answers. The categories element is similar to checkbox, the possible answers, however, are always shown as buttons.

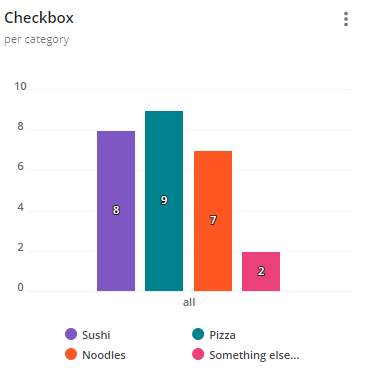
To create a graph, you need to add all possible answers to the graph, and for each data series, filter the series to the corresponding answer. Set them to ‘Count’ as data calculation, and group the data against ‘All data’, to see how often an answer was selected overall. You can best use the column chart for this: