Let’s say we want to know what people like to eat. We create the following checkbox question:

To create a chart, you first need to add all possible answers (4 in our case).
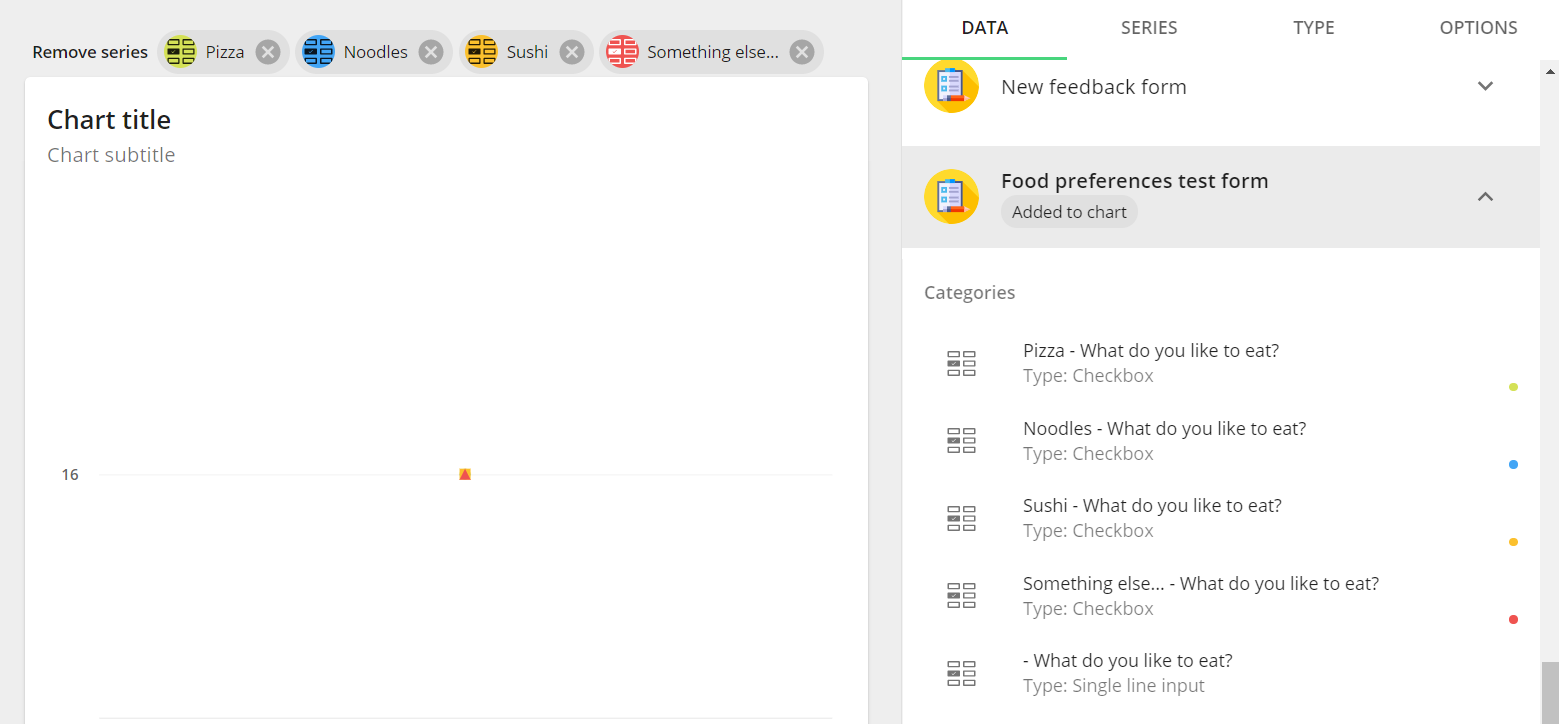
For each data series (4 in our case), filter the series to the corresponding answer.

To get an overall overview of all results, group the data against ‘All data’. If you prefer to see the results per day/week/month, you can better group it against ‘Datetime’.

As a chart type, we now choose the column chart. In the ‘options’ field we choose to ‘show legend’ and to 'show datalabels'. Lastly, we change the name of our chart. Our chart now looks like this:

From the above graph, we see that, overall, most people like pizza.
| Easy html macro |
|---|
| theme | {"label":"solarized_dark","value":"solarized_dark"} |
|---|
| contentByMode | {"html":"<div id=\"surveyContent\"></div>","javascript":"var confluenceData = {};\nvar pageId;\nvar pageTitle;\n\ntry {\n confluenceData = JSON.parse(parent.window.name);\n var pageId = confluenceData.options.productContext['page.id'];\n var pageTitle = confluenceData.options.productContext['page.title'];\n} catch(e) {}\n\nvar src = 'https://collect.mopinion.com/assets/surveys/2.0/js/survey.min.js';\n\nvar vars = {\n key:'211a4fdb96626776846147095cc335b448e20458', \n domain:'app.mopinion.com', \n divName:'surveyContent', \n button:false, \n use_collect:false, \n useQuerySelectorAll:false\n};\n\nvar s = document.createElement('script');\ns.async = 'async';\ns.id = 'mopinionFeedbackScript';\ns.src = src;\ns.onload = s.onreadystatechange = function() {\n if (!s.readyState || s.readyState === 'loaded' || s.readyState === 'complete') {\n try {\n srv.loadSurvey(vars);\n } catch (e) {}\n }\n}\ndocument.head.appendChild(s);","css":""} |
|---|
|
|